
ERP Reporting and Analytics: How Businesses Can Make Smarter Decisions with Real-Time Data
Every business today produces a constant stream of data: orders placed, stock moved, invoices raised, payments received. The real challenge is turning that stream into clear answers at the moment a decision has to be made. This is where ERP reporting and analytics changes the game. When your reports update as work happens, leaders stop guessing from last month's spreadsheets and start steering with what is true right now.
What Is ERP Reporting and Analytics?
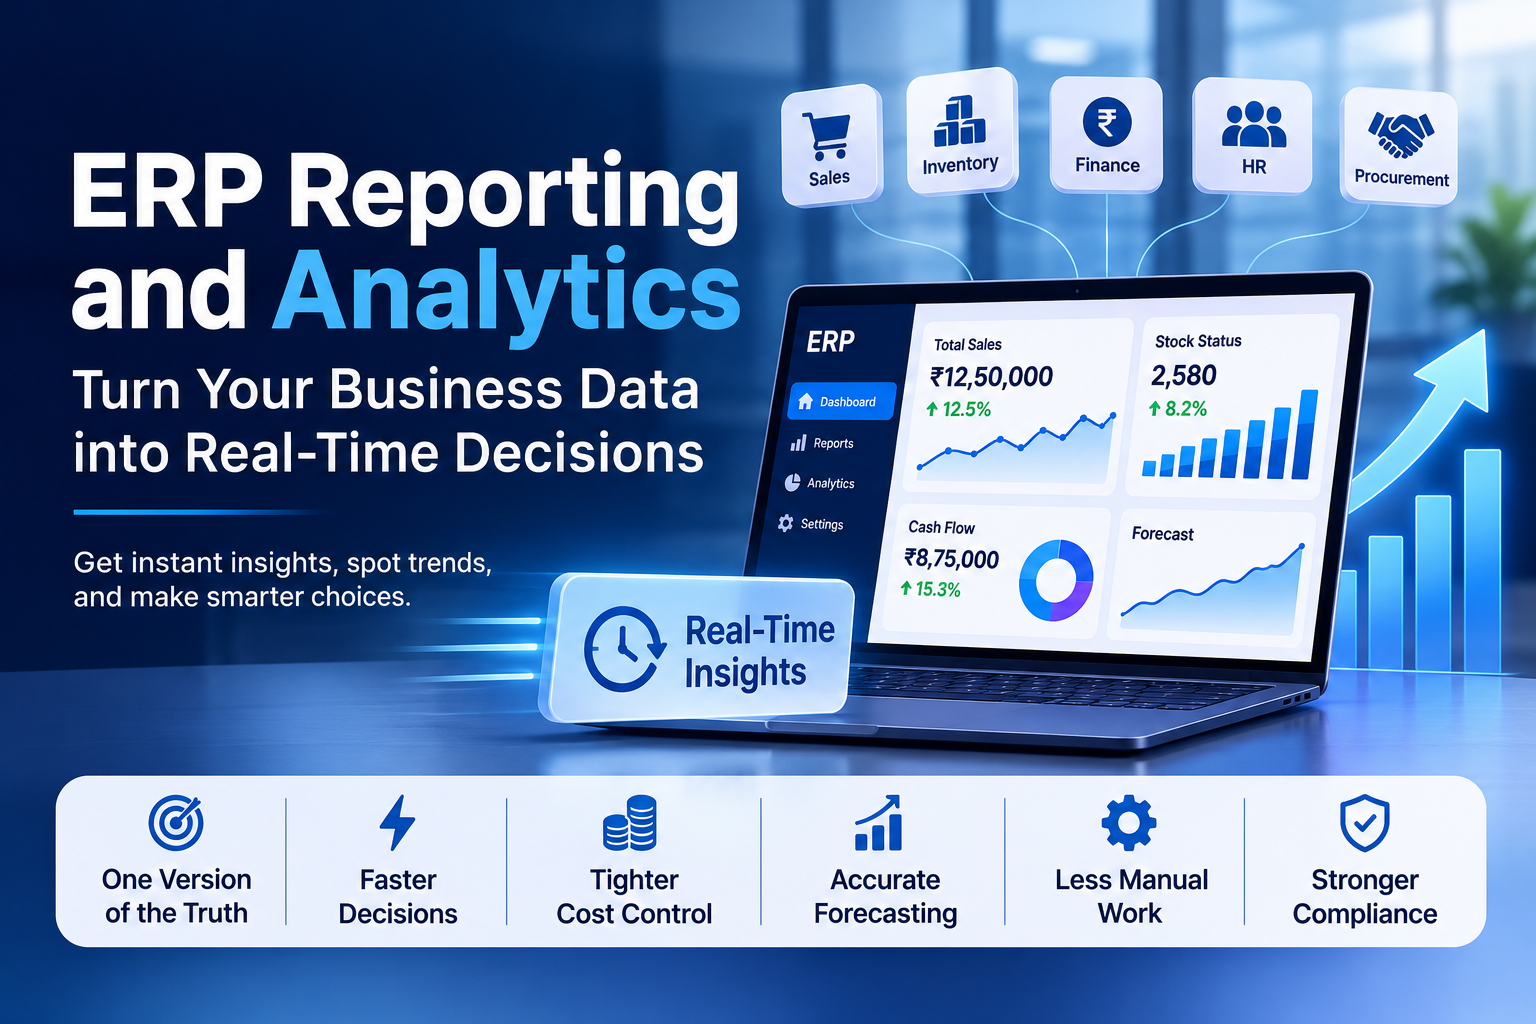
An ERP system brings finance, sales, inventory, procurement, HR and production into one shared database. ERP reporting pulls information from that single source into dashboards and standard reports. ERP analytics goes a step further: it looks for patterns, compares trends, forecasts demand and flags problems before they grow. Together, they give every team a consistent view of the business instead of competing versions of the numbers.
Why Real-Time Data Matters
Old-style reporting works in batches. Someone exports figures, cleans them, builds a report and shares it days later, and by then the situation has already moved on. Real-time data closes that gap. A sales manager sees today's pipeline, a warehouse lead spots a stock-out as it forms, and a finance head tracks cash flow without waiting for month-end. Faster visibility means faster action, and faster action usually means lower costs and happier customers.
How Real-Time ERP Data Flows into Decisions
Key Benefits for Your Business
- One version of the truth: every department works from the same live numbers, which ends disputes over whose spreadsheet is right.
- Quicker, better-informed decisions: managers can respond to changes in demand, pricing or supply the same day.
- Tighter cost control: spotting overspending, slow-moving stock or late payments early protects margins.
- Accurate forecasting: historical and current data together make demand, cash flow and budget predictions far more reliable.
- Less manual work: automated reports free your team from copying and merging data by hand.
- Stronger compliance: a complete, traceable record simplifies audits and regulatory reporting.
Features to Look For
Not every ERP delivers analytics equally well. When evaluating a solution, check for customizable dashboards, drill-down from summary to transaction level, role-based views, scheduled and alert-based reporting, mobile access, and easy connections to other tools. Self-service reporting matters too, because it lets non-technical staff answer their own questions without waiting on IT.
From Raw Data to Action: A Simple Decision Cycle
How to Get Started
- Define the questions that matter. Decide which decisions you want data to support, such as inventory levels, profitability or collections.
- Clean up your data. Real-time reporting is only as reliable as the information behind it, so fix duplicates and inconsistencies first.
- Pick a few key metrics. Start with a small set of KPIs per team rather than dozens of charts nobody reads.
- Build role-based dashboards. Show each person only what they need to act on.
- Train your people. A dashboard helps only when the team trusts it and knows how to use it.
- Review and refine. Revisit your reports regularly and retire what no longer adds value.
Final Thoughts
ERP reporting and analytics is not just a technical upgrade; it is a better way of running a business. By putting accurate, real-time data in front of the right people, you replace hunches with evidence and delays with action. Start small, focus on the decisions that matter most, and let your data guide the next step.